Blog Details

Quantifying the energy cost savings from 2G/3G network shutdowns

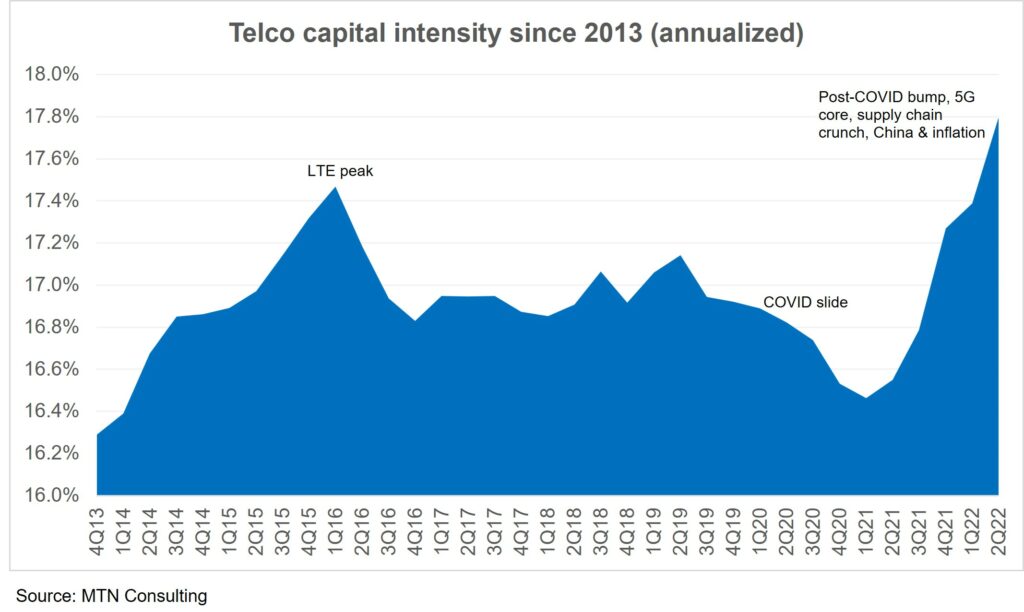
With each passing day, the 2G and 3G layers of telcos’ mobile networks are looming as heavy loads on operating expenses (opex). That’s due to multiple issues but especially energy consumption and related costs. With the existence of a 4G layer in these networks and the coming, if not already deployed, energy-hungry 5G layer, such loads become even heavier. Even before 5G has become widespread, energy costs averaged to about 4% of telco opex in 2021, based on an MTN Consulting study

Quantifying base station energy costs by generation

Many telcos publish data on their energy consumption, and sometimes provide breakdowns for different parts of the network. But there are no existing estimates on the specific impact of maintaining 2G/3G networks alongside 5G. This blog attempts to quantify the effect of these older 2/3G mobile networks on a typical telco’s energy bill. 

To accomplish this, first, we need to have a closer look at overall electrical energy consumption for mobile telcos, and then break down this consumption into parts, identifying what portion of total energy relates to the base station and what parts of the base station consume the most energy.

One complication is that a pure “mobile telco” is rare: most telcos providing mobile services also provide many other services, and operate network assets well beyond the mobile RAN. Some telcos providing mobile services began their lives long ago as fixed operators. Some started as mobile but acquired or built fixed assets to support converged offerings. Some have provided both fixed and mobile services from the start. Some provide cloud or other services mainly aimed at enterprise markets. The energy consumption patterns differ across operator types. Figure 1 illustrates this, for a few large telco groups.  

Figure 1: Mobile network as % of total network usage, select telcos


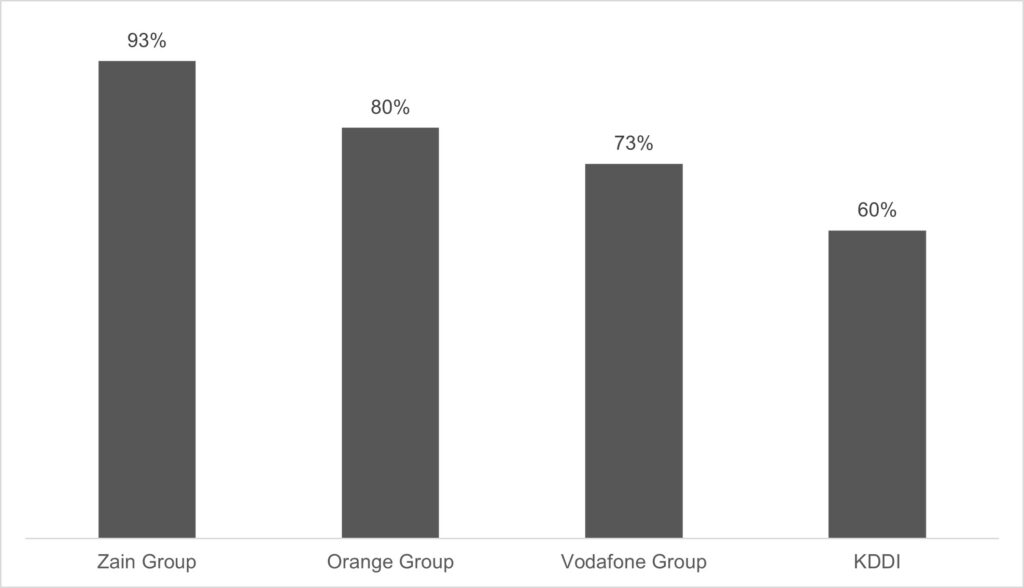
Source: public reports and MTN Consulting estimates

To remove this confusion, we will consider mobile telecom companies that still rely exclusively on providing mobile telecom services. For such operators, the mobile network accounts for about 90% of total company energy consumption and costs. There is some limited variation around this 90% figure, due to vendor choice, network topology, and traffic mix, but 90% is a reasonable estimate. 

Taking KDDI as an example from Figure 1, this company provides a range of services that are not mobile related; MTN Consulting estimates that KDDI’s mobile network accounts for only about 60% of total company energy consumption. But for Zain, this ratio is 93% as this company is almost exclusively focused on mobile services. 

After concluding that about 90% of a mobile-only network provider’s energy consumption is from the mobile network, we need to dive deeper inside the mobile network to find the network elements that contribute most directly to energy consumption.

The mobile network consists of different parts like core, transport, and base stations. As shown in Figure 2, the base stations, or the mobile radio access network (mobile RAN), account for about 57% of network energy consumption for a mobile operator. Expressed differently, the mobile RAN accounts for about 51.3% (i.e. 90% * 57%) of total company energy consumption for a mobile-only operator, such as Zain.  

Figure 2: Base station’s contribution to mobile network energy consumption 


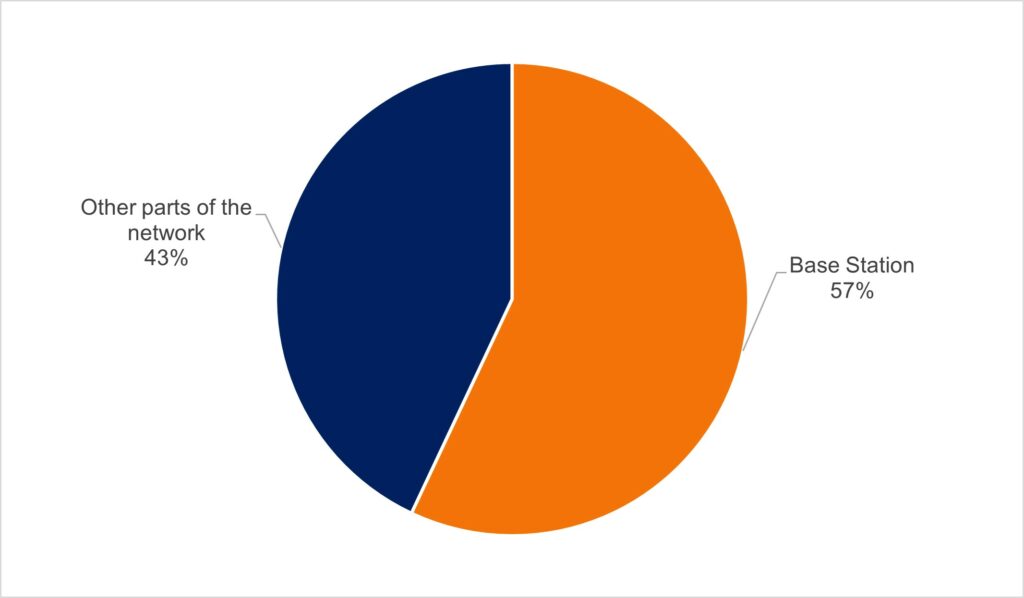
Source: IEEE Communications Surveys and Tutorials

Now we need to examine the base station and have a closer look at the base station elements and their corresponding energy consumption. As shown in figure 3, the base station element that consumes the largest portion of energy is the power amplifier (PA), which consumes around 75% of total base station energy consumption as shown in figure 3.

Figure 3: Base station energy consumption distribution by network element  


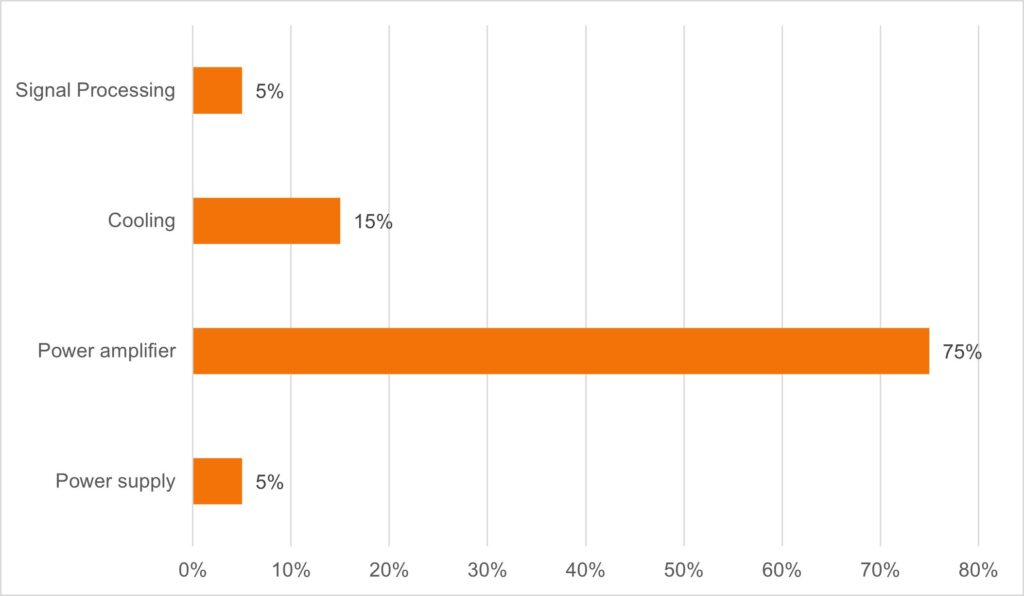
Source: Journal of Energy

As shown above, the power amplifier element is the biggest energy consumer in a mobile-only telco network. The power amplifier accounts for about 38% of total company energy consumption: 75% * 57% * 90%. So if a mobile network operator turns off the 2G network layer, the bulk of energy savings will come from shutting down the power amplifier that corresponds to the 2G network. 

Now that we have quantified the amplifier’s contribution to total energy use, will this 38% figure be enough to measure the benefits of shutting down the 2G and 3G layers? Actually, we still need one more number: the energy consumption of the power amplifier for each technology. In other words, what is the energy consumption percentage for each of these technology layers? Let us have a look at this in Figure 4.

Figure 4 is a presentation of the key components in a base station and their typical energy consumption, in three different network configurations. The columns show the configuration of a typical base station, and the rows are the affecting elements, mainly the power amplifiers. The gray colored boxes are the elements needed for the 2G and the 3G layer, blue colored boxes are the elements needed for the 4G layer, green colored boxes are the elements needed for 2G, 3G, and 4G, and lastly, the orange colored boxes are elements needed for the 5G layer.

Figure 4: Energy consumption of key components in a base station, across three network configurations

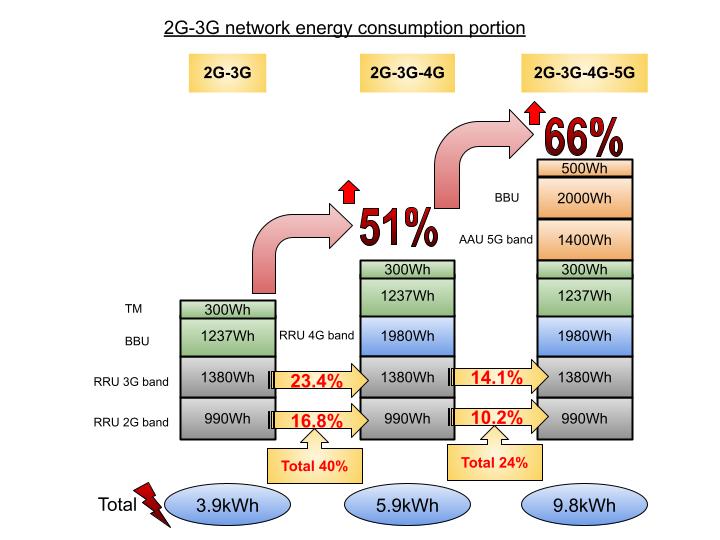
Sources: MTN Consulting; Huawei Technologies

The values inside the elements represent the maximum energy consumption of that element. So as shown in figure 4, in 2G/3G only, the base station consumes 3.9kWh. By adding a 4G layer onto the base station, you increase the energy consumption of this base station by 51%. By adding a 5G layer on top of the 2G, 3G and 4G base station, you can expect another 66% increase in energy consumption. The red arrows in Figure 4 indicate these increases in maximum energy consumption.

That 66% figure illustrates one thing that is scary about 5G: yes, it may offer revenue upside, but it also consumes lots of power to operate 5G, which costs money and has climate impacts.

For this blog, though, what we really need to know is the contribution to total energy consumption of the legacy network elements as you upgrade to newer technology. These values are presented in figure 4 in the yellow arrows. So, in 2G/3G/4G base stations, about 40% additional energy is consumed by holding on to the 2G and the 3G layer. Similarly, in a combined 2G/3G/4G/5G base station, roughly 24% extra energy is consumed because of still holding the 2G and the 3G layers in this base station.

We now have the estimates we need to find the impact of supporting the 2G/3G network layers alongside 4G/5G for a typical mobile operator.  

Approaches to 2G/3G network shutdowns vary depending on current network design

Right now telcos are wrestling with the best way to deal with legacy networks, while they upgrade to 5G. The ideal solution depends on the current position of the operator’s network. In the following table, you can see some potential paths to 2G/3G network shutdowns and the impact on energy consumption. In the first scenario, where the telco currently has only 2G and 3G network layers, an upgrade straight to 5G would result in an approximate 50% reduction in energy costs. In the last scenario shown on the bottom of the table, where an operator is simultaneously operating 2G, 3G, 4G, and 5G networks, the ideal solution is to shut down the 2G and 3G layers. This would save an estimated 40% in base station energy consumption. 

Of course, energy costs are not the only factor in planning 2G/3G network shutdowns: spectrum, regulatory, legacy service revenue, and other factors also matter. But telcos nowadays are very focused on reducing their opex burden whenever possible, given weak revenue growth. As such, energy costs are a central focus of most telcos.

Table 1: Energy usage impact of 2G/3G shutdown scenarios

Mobile network’s current scope Likely migration path for 2G/3G shutdowns % reduction in energy use for typical base station
2G and 3G network Upgrade straight to 5G, bypassing 4G, then shut down both 2G and 3G 50.0%
2G and 4G network Upgrade to 5G then shut down the 2G layer 30.1%
3G and 4G network Upgrade to 5G, then shut down the 3G layer 33.2%
2G, 3G and 4G network Upgrade to 5G, then shut down both 2G and 3G layers 39.9%
3G, 4G and 5G network After upgrading all sites to 5G, shut down the 3G layer 33.2%
2G, 4G and 5G network After upgrading all sites to 5G, shut down the 2G layer 30.1%
2G, 3G, 4G and 5G network The operator is ready to shutdown both the 2G layer and the 3G layers 39.9%

Source: MTN Consulting

The above table represents cost savings for the “typical” mobile-only telco we described early in the blog. In follow-up blogs, we expect to detail the impacts of 2G/3G network shutdowns for a few specific mobile operators in different regions of the world.

*

The author, Samir Ahmad, is a telecommunications and IT consultant based in Amman, Jordan. Samir has a Master’s in Telecommunication, Electrical, Electronics, and Communications Engineering, from the University of Sydney, and a B.S. in Electrical Engineering – Communications & Electronics, from the Jordan University of Science & Technology. Prior to entering the consulting field in 2017, Samir worked for Zain Jordan for 8+ years, most recently as Expert, RF Planning and Optimization.  

Blog Details

Telco capital intensity hits 10 year peak in 2Q22

Vendors continue to wrestle with supply chain constraints in the telecom sector. That’s clear from several recent vendor earnings reports, including those issued by Dell, HPE, and Ciena in recent weeks. Telco spending, though, has surged in recent quarters. With 2Q22 results now compiled, the industry has reached a new capex peak. For the 12 months ended June 2022, telco capex was $329.5 billion (B), while the ratio of capex to revenues (i.e. capital intensity) was 17.8%. Both figures represent new record highs, at least for the 46 quarter (11.5 year) period that MTN Consulting data covers (1Q11-2Q22).  

On the supply side, vendors selling into the telco vertical are seeing some growth, in aggregate. For the broadly defined “telco network infrastructure” (telco NI) market, revenues were $60.1B in 2Q22 (up 4.1% YoY), or $237.6B on an annualized basis, up 6.7% YoY. The telco NI market includes some vendor revenue streams which dip into telco opex, not capex, but there is usually a correlation between total capex and vendor revenues.

The figure below illustrates telco capital intensity over the last several years.

What’s behind recent capex growth

One factor behind the recent capex spending spike is a post-COVID bump. Economies shutdown during COVID, depressing network spend. The capital intensity effect is shown in the figure, above (“COVID slide”). Capex also dropped in absolute terms. Annualized capex bottomed out at $299.8B in 2Q20. Some of the current growth is just making up for lost time. The quarterly average hasn’t changed much, if you expand the time horizon. For the last ten quarters, from 1Q20 (the onset of COVID) through 2Q22, telco capex averaged out to about $77.9B per quarter. For the ten pre-COVID quarters, the average was $78.5B.

Another factor is many telcos are scaling up initially small 5G deployments, and beginning to build out 5G SA core networks. 5G RAN builds have been underway for several years, but the spending has been small to start due both to the software-centric nature of 5G networks and telcos’ desire to wait for new revenue models to emerge. Incidentally, a shift to 5G core spending tends to benefit a different type of vendor – not just the Ericssons and Nokias of the world. Cloud providers AWS, Azure and GCP, for instance, are all actively involved in helping telcos with 5G core migrations. Their collective revenues in the telco vertical were about $3.4B for the 12 months ended June 2022, up nearly 80% YoY. Many of the vendors involved in this are less vulnerable to supply chain issues.

Another capex plus: fiber spending is strong in a number of markets, especially the US but also in Europe, Australia, China, and India. That’s to support FTTx deployments but also to connect together all the new radio infrastructure needed to support 5G. Government subsidies and other investment incentives are a factor as well. Vendors focused on fiber optics are seeing strong growth right now. For instance, Corning and Clearfield saw their telco vertical revenues grow by 25% and 84% YoY in 2Q22, respectively.

Supply chain limitations have a mixed effect. They sometimes mean delay or cancellation of projects, which cuts capex in the short term. They also can mean price increases, though, as telcos push suppliers to accelerate timelines or adjust designs to work with available alternatives. This can result in projects costing more than expected. Let’s not forget, though, that a huge portion of telco spend is unaffected by current supply chain constraints. Services- and software- focused vendors – like Accenture, Amdocs, IBM, Infosys, TCS and Tech Mahindra – are not citing supply chain issues as a drag on results. 

Inflation is a bit more straightforward. This has impacted the entire telecom food chain, from chips to components to systems to services. All else equal it causes an increase in US$ capex, though the impact on capital intensity is less clear. 

Finally, there’s China. Given how closed a market this is, there’s not as much attention paid to it nowadays. But China’s capex has been growing recently. For the 2Q22 annualized period, Chinese telco capex totaled $58.3B, up 12% from 2Q21. That growth comes despite efforts to share costs on the network side.

China is also relevant to the vendor share question. Huawei continues to rank at the top of the global telco network infrastructure (telco NI) market. For the 2Q22 annualized period, we estimate its telco NI share at 18.7%, far ahead of Ericsson (10.9%) and Nokia (8.9%). This surprises some, as Huawei has become a non-factor in many markets over the last two years. Yet Huawei’s stability is no mystery. It’s dominant at home, and local telcos have been spending big, and steering more of their capex dollars to local suppliers over the last couple of years. Huawei also has a huge customer list overseas – these revenue streams don’t just disappear overnight, especially since many telcos remain loyal to the vendor.

Hardware hit hardest in supply chain crunch

Vendors recorded about $237.6B in sales to the telco vertical for the 2Q22 annualized period. This is a huge market, with many different players; MTN Consulting stats track 132. Some supply the latest and greatest hardware innovations. They often have high margins but can also be subject to supply chain hiccups. Vendors specializing in solutions which revolve more around software and/or services tend to have different constraints. Labor cost and availability is always a concern, but hardware is rarely an issue. We believe the current supply chain disruptions will improve in the next couple of quarters, though. Even those vendors hit by short-term supply issues are generally optimistic. For instance, Gary Smith, Ciena’s CEO, noted last week that “Despite supply chain challenges and elongated lead times, strong secular demand trends show no signs of abating. And we remain confident that the fundamental macro drivers propelling this demand are durable over the long term.”

The biggest near-term risk to that is China’s ongoing series of COVID shutdowns. Longer term, the bigger risk is any interruption to Taiwan’s ability to continue functioning as an independent, self-governing country – it plays a key role in the telecom supply chain, and that of many other sectors. This issue is the elephant in the room that few like to address, but all vendors need to have a plan for this worst case scenario.

*

Source of cover image: iStock

Blog Details

After failure to adapt to 4G, telcos need to evolve

It was the Greek philosopher Heraclitus who coined the phrase, “Change is the only constant in life.”

Well over a thousand years later, Benjamin Franklin continued the thought, saying, “When you are finished changing, you are finished.”

From the wheel to the internet and beyond, the need for change, for new ideas, new technologies, has been a defining element of humanity. Through trial and error, innovators conceive of an idea, conduct research, prove their hypotheses, and develop and refine their concepts. Such research and development have become absolutely vital to the success of the telecommunications industry. Without R&D, humanity might never have evolved past the rotary-dial telephone. There would be no internet, no cell phones, none of the technological marvels we often take for granted … amazing tools that our predecessors likely could not have envisioned even in their dreams.

Or… perhaps they did. After all, the myriad technologies of science fiction are continually becoming science fact. For example, many of the technologies of the original “Star Trek” are commonplace today. The communicators, viewscreens and tricorders of that fictional future exist today as cell phones, laptops, video chats, and advanced sensor packages.

AT&T is another example. Back in 1993, the telecommunications provider (telco) aired commercials that examined what its researchers were developing, and extrapolated the impact of those technologies on the future. The commercials accurately predicted global positioning systems, laptops, tablets, smart watches, keyless entry and on-demand video entertainment … in an era before most homes even had internet connections or home computers.

That was nearly three decades ago. In the time since, you’d expect that AT&T would be spending more on R&D, particularly this far into the digital age.

You’d be wrong.

From 2000 to 2021, AT&T’s annual spending on R&D hovered between 0.7 percent to 1.3 percent of its total revenue. For 16 of those 22 years, AT&T’s R&D expenditures remained less than 1 percent of the company’s total revenue.

Surprised?

Don’t be.

Other telcos show much the same spending pattern. From 2018 to 2020, SK Telecom spent an annual average of a mere 2.2 percent of its revenue for R&D expenses. Telefonica spent less, at 2 percent. NTT spent 1.9 percent; Chunghwa Telecom, 1.8 percent; Orange, 1.6 percent; Comcast and KT Corp., 1.1 percent; and China Telecom, 1.0 percent. Most others, including AT&T (0.7 percent) and LG Uplus (0.4 percent), spent less than one percent of their overall revenue on R&D.

“Telcos (tend to) spend very little on R&D, instead relying mainly on their suppliers for innovation,” Matt Walker, chief analyst at MTN Consulting. “The world has hundreds of telcos but only a few dozen significant suppliers, so some of this is inevitable. The smaller telcos can’t afford to do it all themselves,” said Walker, as they often lack the staffing or the financial resources to conduct their own R&D.

On top of their lack of spending, telcos are also largely slow to innovate. When 4G wireless debuted, telcos rejoiced at the idea of earning new revenues from the networks, which were expensive. However, the majority of the revenue from the new networks went to the companies that build telecommunications devices, like Apple; app companies; content providers, like Netflix; and cloud services companies. This left telcos out in the cold, as they could buy the technology needed to provide 4G, but not truly profit from it.

When 5G networks emerged, the telcos spent big, again hoping for a revenue upside from the investment. Thus far, however, they are in the same position where 4G left them … not benefitting financially, and still wary of spending much on their own innovation and R&D.

“This arrangement worked alright when telcos had limited competition from other sectors,” Walker noted. “However, in the last five years or so, these new ‘big tech’/webscale players have begun encroaching on different aspects of the telco turf.”

Are telcos doomed to repeat the same mistakes? Hopefully not.

Should they be spending more on R&D to help develop new revenue streams? Yes.

Are there examples of leaders in the sector to learn from? Yes.

Telcos should not have to wait on their downstream vendors to innovate and create new technologies, from which they can benefit. Instead, they should take advantage of the growing and rapidly evolving technologies and innovate on their own.

Indeed, some industry leaders are already beginning to call for such a paradigm shift. Aaron Boasman-Patel, vice president of AI & Customer Experience at TM Forum, and Brian Smyth, Accenture’s Global Comms & Media Innovation Lead, conducted research on the matter, the results of which they published in their white paper, “The tech-driven telco.”

“At the most basic level, the world has changed since the telco business model was introduced,” said Smyth. “… At Accenture, we see three mega trends, the first one being the customer – so how we live our life, how we engage with civil society and government, how we work; the second being business model reinvention, … how technology transforms not only customer experiences, but also how customers buy into products and services. We’re seeing within this also a big focus on partnership and partnering together with other organizations to offer new services and experiences.”

“And then finally, it’s the technology revolution. So, in telcos a lot of talk today is around 5G, edge networks, and a lot of this is the confluence of these three points of customer imagination, reinvention, and the technology revolution I think are all leading to this transformation from the traditional telco” to a more tech-driven model.”

Added Boasman-Patel, “If you don’t evolve, then you’re not going to be able to take a slice of the pie – the $700 billion worth of new revenues which are out there today. … If you think about, what we’ve seen through the pandemic, telecoms shares have increased by about 4.8 percent compared to other industries like semiconductors and electronics up by nearly 50 percent, media technology, high 35 percent. … I think when you get above 20% of (revenue spending), whether in industrial manufacturing, or sensor management or whatever it may be, that’s where you can start to say you have become a true techco,” he said.

In November 2021, Ericsson, the world’s second-largest supplier of technology to telcos,  surprised many observers by announcing that it was purchasing Vonage, a cloud communications company. That one company would acquire another is standard fare for financial news. Also, it wouldn’t be unprecedented for a telco to buy one of its vendors. The November deal, however, was the reverse: Ericsson, a vendor/supplier to telcos, was buying Vonage, a telco.

“That deal was surprising because it was a traditional vendor buying what seemed to be a telecom provider/telco, i.e. Vonage,” noted Walker.

Unlike the typical telco, vendors do usually spend quite a bit on R&D. Ericsson, for example, spent an annual average of 17 percent of its revenue for 2019-2021. Many others spend less, including Alphabet and ZTE (15 percent each); Microsoft (13 percent); Amazon (12 percent); Samsung (9 percent) and IBM (8 percent). In contrast, Ribbon Communications spent 24 percent; Juniper Networks (21 percent); Nokia (19 percent); and Huawei (18 percent). Alphabet and Microsoft are included in these figures because their cloud divisions GCP and Azure, respectively) have become important suppliers to telcos.

Figure 1: R&D spending as % of revenues for select Telco NI vendors, 2019-21 average


Source: MTN Consulting

Ericsson made the $6.2 billion deal in the hopes that, if approved by regulators, its acquisition will help it work with telcos to better monetize apps and services. Ericsson has mapped out a plan to help their telco customers get new sources of revenue from the new networks currently being built.  Its acquisition of Vonage means that it now has a telco subsidiary with a dedicated R&D mission. Indeed, unlike the regular low numbers shown at other telcos, Vonage’s R&D numbers tend to trend higher.  In 2011, Vonage spent 1.8 percent of its revenue of R&D. In 2014, that number rose to 2.4 percent. In 2019, it hit 5.8 percent, then rose to a high of 6.5 percent in 2020 before dipping to 5.7 percent.

Indeed, Vonage hews closer to the “techco” model favored by Boasman-Patel and Smyth than it does to that of a standard telco model.

“I think mindsets are really important here to drive that change,” said Smyth. “A really interesting example is Microsoft. When Satya Nadella took over Microsoft in 2014, at that point they were hugely profitable as an organization, but not very exciting. And Satya talked about actually wanting to build an organization and products and services that customers would love. And they had missed big trends at this point. They had missed things like search (engines) and mobile, and a lot of people were questioning whether Microsoft’s best days were really behind it at that point, where he came in with this focus on building this growth mindset.

Smyth continued, “The growth mindset is actually … about shifting from the sort of know-it-all to the learn-it -all mindset and being hungry and open to change and collaboration. And what we’ve seen since is a 10x growth in the market cap of Microsoft. And an incredible performance and a complete refresh of the brand, attracting young talent, attracting the next generation of sort of leaders across new technology domains and re-cementing their position in future technologies, whether it’s cloud, or now looking at the metaverse.”

Vonage, like Microsoft, leaned into its own evolution.

“Vonage was no longer just a telco” by the time Ericsson announced the acquisition deal in 2021, said Walker. “It started life as this, but had evolved more into a hybrid in the last five years, creating lots of its own intellectual properties (IP). From 2018 to 2021, Vonage spent about 6 percent of revenues on R&D, way higher than the average telco, and closer to a vendor.”

Indeed, Vonage’s most recent annual report tells the story of its evolution from telco to techco: ““Founded in 2001, Vonage was among the first companies to provide Voice over Internet Protocol technology offering feature-rich, low-cost home phone services. Through a series of strategic acquisitions and organic growth, Vonage since has transformed from a VoIP-based residential service provider to a global leader in business cloud communications.”

Vonage also has a long list of patents, which helps fuel its innovations.

“Vonage does some things that don’t look like what a vendor (Ericsson) would normally do,” noted Walker. “But Vonage’s R&D creations (will) allow Ericsson, in theory, to provide valuable support to its other telco customers in an important area, i.e. monetizing the network through use of APIs,” or Application Programming Interfaces, which permit different applications to communicate.

Although most U.S. telcos continue to play it safe, telcos in the United Kingdom have begun to increase their R&D sending. In 2020, they spent over 1 billion pounds (1.2 billion pounds, or $1.56 billion USD) on R&D … the first time they have done so in nearly 10 years.

According to the British Office for National Statistics, the telco sector boosted its R&D spending by 4.5 percent during 2020, to 1.03 billion pounds. They last spent that type of money on R&D in 2011, when they spent 1.04 billion pounds.

However, not surprisingly for a time during a pandemic, UK R&D spending by telcos and all other industries remained in the shadow of pharmaceutical sector, which boosted its R&D spending by 6 percent to 5.02 billion pounds ($6.19 billion USD).

“There’s a demand from industry to actually partner and collaborate with (communications service providers) to build out these new services,” said Smyth. “… It’s quite interesting from some of the initial feedback we’re hearing there is a desire on the CSP side to really just offer connectivity solutions, sell connectivity. So, I think what industry is looking for is support in solving their business problems. And I think there’s great opportunity for CSPs as they’re building the scalable platforms to actually go in and partner and co-create with industry to build solutions.”

4G set sail some years ago, and telcos largely missed the boat. It’s still relatively early in the rise and growth of 5G. Hopefully, telcos will learn from the mistakes they made with 4G. If they prioritize creating and funding new R&D initiatives, they can evolve into more technology-driven companies. This will allow them to benefit, in terms of technology and revenues, from 5G.

It’s not too late for telcos to fully get on board with 5G … before that opportunity also sails out of reach.

About the author

Melvin Bankhead III is the founder of MB Ink Media Relations, a boutique public relations firm based in Buffalo, New York. An experienced journalist, he is the president of the Buffalo Association of Black Journalists, and a former editor at The Buffalo News.  

*

Cover image: iStock

Blog Details

Cisco, Samsung, and ZTE benefit most from Huawei bans in 2021 telco NI market

2021 results for the 100+ vendors selling into the telco market are just about finalized. Contrasting 2021 “telco network infrastructure” (Telco NI) share with 2020, Cisco clearly came out on top, gaining 0.7% share in a market worth $231.4 billion (B). Cisco was helped both by a telco shift in 5G spending towards core networks, and Huawei’s entity list troubles. Samsung’s share growth of 0.3% was due to a big win with Verizon and a growing telco interest in seeking RAN alternatives beyond Ericsson and Nokia. ZTE, which has escaped the US entity list to date, also picked up some unexpected 5G wins but its growth is more broad-based due to optical, fixed broadband, and emerging market 4G business.

Dell (including VMWare), Microsoft, and Amazon also picked up share as telcos have begun investing in 5G core and cloud technologies. Their growth has little to do with Huawei, and more due to telcos’ ongoing changes to network architecture and service deployment patterns. Corning was an unexpected winner in 2021, gaining 0.2% share on the back of fiber-rich wireless deployments and government support for rural fiber builds.

On the flip side, both Nokia and Ericsson lost share in the overall telco NI market in 2021. Their RAN revenues benefited from Huawei’s troubles in 2020 but telco spending has since shifted towards product areas with more non-Huawei competition. Both vendors are attempting to diversify beyond the telco market, with Nokia so far having more success; its non-telco revenues grew 12% in 2021.

Huawei’s share of telco NI declined to 18.9% in 2021, down from a bit over 20% in both 2019 and 2020. The US Commerce Department’s entity list restrictions were issued in May 2019 but hit the hardest in late 2020 and 2021, after Huawei’s inventory stockpiles began running out.

Huawei’s messaging on its recent fall is muddled. During its annual report webcast yesterday, it cited three factors behind its 2021 revenue decline: supply continuity challenges, a drop in Chinese 5G construction, and COVID. In MTN Consulting’s opinion, supply continuity was the main factor. A related factor were the many government-imposed restrictions on using Huawei gear around the world, especially in Europe where 5G spending was strong in 2021. The other two factors cited by Huawei’s CFO, however, are misleading. Chinese telco network spending, overall, was relatively strong in 2021: total capex for the big three telcos was $52.8B, up 8% from 2020. Without this rise, Huawei’s 2021 results would have been worse. As for COVID, few other vendors cite the pandemic as a factor restraining 2021 telco spend. More vendors cite the opposite: 2021 spending was strong in part because telcos were forced to delay many projects during COVID’s early spread.   

To date, Huawei’s troubles have impacted RAN markets the most, but in 2022 and 2023 will begin spreading more clearly to IP infrastructure, optical, microwave, fixed broadband, and other areas. A number of vendors are eager to pursue new opportunities as this happens, including Adtran/ADVA, Ciena, Cisco, CommScope, DZS, and Infinera. The CEO of Infinera, in fact, said on its 4Q21 earnings call that “it was a nice taste, a nice appetizer in 2021, but…we said all along that we would see the design wins and RFPs really scaling and we thought that we’d see revenues from that really beginning to take hold as we got into 2023.”

To date, Huawei has been unable to fully adapt to the supply chain restrictions put in place in 2019. It remains the global #1 in telco NI, however, due to dominance in China and a huge installed base across the globe. The company is investing heavily in carrier services & software, Huawei Cloud and new product areas. One certainty is that it won’t simply fade away, despite the current decline.

Blog Details

Organic revenue growth continues to be a stretch for telcos in 1Q21

Organic revenue growth continues to be a stretch for telcos in 1Q21

Two weeks ago, we provided a preliminary view on revenue trends based on the first 13 significant telcos to report 1Q21 earnings. In it, we noted that revenue growth rates appeared promising for 11 of these 13, as the YoY % change in 1Q21 was improved relative to 4Q20. However, we also flagged a trend of concern, namely, that much of the apparent telco revenue growth was coming from sales of equipment (e.g. handsets) rather than core services. This has been happening on the mobile side with new 5G device sales, and also with cable companies catering to the work from home crowd. A survey of 25 additional telcos which have reported since our last newsletter confirms this trend. Telcos are still not persuading investors that the new services they are investing heavily to develop will lead to significant top-line growth. 

Revenue trends in 1Q21 – the latest 25 reporters

The figure below illustrates the difference in the YoY revenue growth rate achieved for the group of 25, comparing 1Q21/1Q20 to 4Q20/4Q19. As shown, 18 of the 25 improved their YoY revenue trend line at least a bit between 4Q20 and 1Q21. 

YoY revenue growth in 1Q21 for telcos, v2

Thailand’s biggest telco, AIS, had the best result of the 25 due to aggressive investments in both 5G and consumer fiber broadband completed in 2020. Its 4Q20 revenues declined by 7% YoY, while 1Q21 revenues grew by 7%, netting a positive 14%. Liberty Global grew by double digits as well, but that’s almost entirely due to recent acquisitions (of Sunrise, and Vodafone properties). 

The worst performer of the group was Dish Network, but this is misleading as the company is ramping up a new service so growth rates will inevitably decline over time. Telenor had the second worst result of the group, for more substantive reasons: its Myanmar operations have collapsed amidst political unrest, and its Thailand arm DTAC is running behind rivals True and AIS in 5G rollouts. To compensate, DTAC is now accelerating a 5G rollout based on 700MHz spectrum, and Telenor is attempting to gain scale in another regional market, Malaysia, by merging its local operations with Axiata. At the corporate level, Telenor continues its long-running efforts to optimize its operational cost base: it claims a 7% company-wide decline in opex for 1Q21.

For the largest companies in the group of 25 – Comcast (#6 globally by revenues as of 3Q20), Charter (#13), KT (#17), and BCE (#19) – BCE and KT made the biggest gains between 4Q20 and 1Q21. However, as noted below one-time sales of equipment were a major factor for both. It was also a major factor for AIS, in fact.

The table below provides a summary of total revenue growth in 1Q21 for a subset of the 25, and the growth reported in non-service (equipment) revenues for the same time period. As shown below, equipment revenue growth outpaced the total company trend line for nearly every telco, in some cases by huge margins (e.g. Dish, AIS, Global Telecom, Etisalat). SKT was the only exception, as its corporate revenues climbed by 7.4% in 1Q21, while the non-consolidated “others” category of sales (which includes handsets) grew by just 3.8%. Not unrelatedly, SKT is planning to spin off part of its operations in the near future, in particular the parts growing faster than its telco core.

rev v eqpt rev 1q21 next 25

Only 17 of the 25 are included above because the rest do not report equipment revenues, as they (generally) lease CPE to customers and capitalize the gear onto their balance sheets. That’s true for Cable ONE, Charter, Cincinnati Bell, Cogeco, Comcast, Consolidated, and Liberty Global; the 8th of this group is Turk Telekom, which does not publish its non-service (equipment) revenue figures for other reasons. 

Capex trends – changes in capital intensity due to 5G, fiber, and transformation

Much of MTN Consulting’s research is concerned with network spending trends, so we track capex closely each quarter. We are projecting a slight uptick in telco capex (in US$) for 2021. Based on early stats for 1Q21, this scenario is still likely. There are a number of sizable companies reporting capital intensity (capex/revenue) ratios higher for 1Q21 than 1Q20, for instance. This alone is not a great benchmark, as some telcos were forced to cut back capex in 1Q20 as the COVID-19 pandemic began to spread. Nonetheless, telcos aren’t shying away from modest capex investments in their network in order to improve operational efficiency (e.g. digital transformation, automation) and support a new generation of services on new 5G networks and FTTH.

The table below presents single quarter capital intensity for 1Q21, the change from 1Q20, and the drivers for that change. Not all 25 telcos are shown below; this table includes only telcos which reported capital intensity either >2.0% higher or lower for 1Q21 than the prior year period, 1Q20. Companies are listed according to their relative in capital intensity across these two periods, high to low.

biggest capint swings in 1q12 to date

Who will capture 5G’s value?

As we noted in our last research, many telcos deploying 5G are seeing a revenue uptick related to sales of 5G-capable devices. This also happened with 4G. Looking back, device and app companies captured much of the revenue upside related to deployment of 4G networks. This is a risk with 5G as well. As telcos deploy stand-alone 5G networks and rollout some of the more sophisticated functionality that comes with 5G, they will need to stay focused on deploying new services that deliver them growth. That will not be easy, and will require collaboration with both their vendors and the adjacent webscale sector of operators.

Blog Details

Device revenues are driving a growth uptick for telcos in 1Q21

Device revenues are driving a growth uptick for telcos in 1Q21

As of April 28, 13 of the 138 telecom operators (telcos) we cover in our quarterly tracker have reported 1Q21 earnings. Revenues for the early reporters have been surprisingly strong: all but 2 of the 13 have reported YoY revenue growth rates greater than the 4Q20 vs. 4Q19 result. This comes with a big caveat, however. Nearly all of the 13 owe their relative success to growth in equipment or device revenues, not to their core operations/services. For instance, 1Q21 device revenues climbed by 218% and 45% for China Telecom and AT&T, respectively. Not surprisingly, revenues for key handset suppliers are surging: Apple’s iPhone product revenues grew by 17.1% YoY in 1Q21 to $65.6B, while Samsung mobile device revenues were up 13.0% YoY in 1Q21 to 25.82 trillion Won (~$23.2B). Huawei is down but that is a company-specific situation, and early signs are that other Chinese handset suppliers (e.g. Oppo, Vivo, Xiaomi) did quite well in 1Q21.

On the network investment side, only 10 of the 13 reported capex for 1Q21, as the three Chinese companies in the group report capex only every 6 months. MTN Consulting expects telco capex to grow roughly 4% in 2021, but there is no obvious pattern of growth yet based on these 10 telcos’ reports. Du and Tele2 reported 52%, and 36% YoY growth, respectively, but most of the larger telcos in the group of 10 reported YoY capex declines. Orange was an exception, as it reported 3.1% YoY growth in capex for the first quarter, due both to fiber builds in rural France and international markets as to 5G.

Revenue trends in 1Q21

As the figure below illustrates, total revenues increased on a YoY basis in 1Q21 for 8 of the 13 companies reporting to date. That’s promising given that 2020 revenues for the global telecom market declined by about 1%. Further, there were a number of significant improvements in growth between 4Q20 and 1Q21, for instance China Unicom’s acceleration from 6.9% YoY growth to 11.4%. Growth flipped from negative to positive for Verizon, AT&T and Rogers. One factor is a pickup in economic activity in many global markets as COVID-19 vaccines started their rollout and government stimulus programs took effect. The more important factor is the 4G to 5G transition. 

telco rev change prelim 1Q21

Most of the telcos reporting above operate in markets where that transition has already started: China, USA, Finland, Canada, France, Sweden, and the UAE. America Movil is an exception, as 5G is still emerging in most of its markets. Altice USA is the other exception as its mobile business is tiny and based on an MVNO with T-Mobile. For all others, though, device/equipment revenues related to 5G were the primary driver behind the YoY improvement in 1Q21 revenues:

  • China Telecom: Device revenues up 218% YoY
  • China Unicom: Device revenues up 51%
  • China Mobile: Device/other sales up 67%
  • Verizon: Wireless equipment revenues up 24%
  • Elisa: Devices up by 11%, and “Digital services” (including content/media) up a bit faster, +12%
  • AT&T: Mobility division’s equipment revenues up 45%
  • Rogers: Wireless equipment revenues up 27%
  • Orange: Equipment sales up 10% YoY
  • Tele2 AB: Equipment revenues up by 12% YoY, services declined by 1%
  • Telia: Equipment up 13% YoY
  • Du: equipment lumped into an “others” segment but company said that “Strong demand for the iPhone 12 fuel handset sales”

In their earnings, not all telcos addressed how much of their growth was attributable to one-time handset purchases that are mostly flow-through revenues. China Mobile was more direct, saying its 67% revenue growth in the sales of “products and others” was due to the the “buoyant growth of handset sales as 5G handsets were available with more varieties and at more affordable prices in the terminal market.”

Capex a mixed bag: 5 up, 5 down

Ten of the 13 telcos reporting have published capex figures for 1Q21. As the figure below shows, half reported YoY growth, half showed declines.

telco capex change prelim 1Q21

For all but Altice, the 5G transition plays into the capex fluctuations of all these telcos – with the cost of spectrum an issue that often arises.

Du’s 52% growth in 1Q21 is due to capex spend “mainly on the core network as well as 5G roll-out and on improving mobile coverage and capacity.” Tele2 cites its rollout of nationwide 5G in Sweden, and Remote-PHY on the fixed side. Orange’s modest growth is due to a ramp-up in its core France market aimed at getting Paris ready for its March 5G launch, as well as growing fiber investments in both rural France and overseas markets like Poland. Telia’s slight increase reflects a decline in fiber investments in Sweden offset by rising 5G costs as it builds out the network based on newly secured spectrum in both Sweden and Denmark. Elisa’s ~1% YoY increase is due to 4G capacity increases and expansion of its 5G coverage to reach 2.5 million people in Finland.

Among the capex decliners, America Movil’s dip is due in part to caution surrounding regional currency fluctuation and its December 2020 joint acquisition (with Telefonica and TIM) of Oi’s Brazil business. Moreover, America Movil is determined to implement 5G with minimum effect on capex: its CEO noted on AM’s 1Q21 earnings call that “I don’t think even for this year or for the next years, we [are] going to have an increase — substantial increase of CapEx for 5G.” Altice USA’s 29% dip is due mainly to a huge decline in CPE purchases, which flow into capex for Altice (as for most cable companies). Rogers also reduced capex in 1Q21, perhaps distracted by its huge pending acquisition of Shaw. Going forward, Rogers has committed publicly to major new investments in the network, in particular in rural and lower-income markets.

The two largest companies in the group of 10, by far, are AT&T and Verizon. Their capex outlays in 1Q21 were on the conservative side, falling 15% for Verizon and staying flat for AT&T (including its vendor financing payments). Their capital deployment focus in recent months has been spectrum: in the last two months, AT&T and Verizon have made payments of and $23 billion and $45 billion for C-Band spectrum, respectively, to the US FCC. 

Both companies have a long way to go to build out nationwide 5G coverage and now face an energized T-Mobile post its acquisition of Sprint. That makes their recent splurges on new C-Band spectrum all the more notable. The high cost may cause some pullbacks on capex, or at least a more eager approach to partnerships that may reduce capex, for instance webscale collaborations (e.g. AT&T-Microsoft cloud connectivity, and Verizon-AWS 5G MEC).

Clearly AT&T and Verizon need to buy equipment and software to turn this new spectrum into a usable resource, but the high cost does constrain them on the capex side. Verizon addressed this indirectly in its earnings call, saying that it is “delighted that the credit rating agencies consider the spectrum asset purchases as strategic and critical to our business operations and held their rating levels unchanged.” It’s true that spectrum is a strategic asset, but the same can be said for fiber and data center and other types of infrastructure that compete for capital within a telco budget. Costly spectrum will continue to be an issue impacting US telcos. To the extent all US telcos face this reality, the main effect will be to slow deployments in lower ARPU areas and increase consumer prices, but also encourage adoption of products & architectures which aim to maximize use of scarce spectrum resources.

Who will capture 5G’s value?

Telcos deploying 5G are clearly seeing a revenue uptick related to sales of 5G-capable devices. This also happened with 4G. Looking back, device and app companies captured much of the revenue upside related to deployment of 4G networks. This is a risk with 5G as well. As telcos deploy stand-alone 5G networks and rollout some of the more sophisticated functionality that comes with 5G, they will need to stay focused on deploying new services that deliver them growth. That will not be easy, and will require collaboration with both their vendors and the adjacent webscale sector of operators.

Blog Details

Webscalers ramp up push into telecom in 1Q21

Webscalers ramp up push into telecom in 1Q21

MTN Consulting’s formal review of 4Q20 performance for the webscale sector will be published within a week. Based on preliminary stats, it is clear that the webscale market of operators continued blockbuster growth in 2020, ending the year with just over $1.7 trillion in revenues, from $1.45T in 2019. The growth is due to several factors: acquisitions (e.g. Alibaba-Sun Art, Amazon-Zoox, and Microsoft-Zenimax); strong digital advertising spend (e.g. Google up 9% YoY to $146.9B), and increased cloud spending across a number of verticals amidst the COVID-19 pandemic.

Webscalers have been attacking the telco vertical for several years. Since the close of 4Q20, over the last three months the webscale sector’s efforts to engage telcos have picked up steam. A number of telcos have recently announced new deals with webscalers in the areas of edge computing, service development, digital transformation, and workload shift. At the same time, more traditional suppliers to telcos (e.g. Nokia) have expanded their own collaboration with the cloud providers who dominate the webscale market. These deals aim to differentiate among traditional telco vendors, prevent webscalers growing too fast in the market, and save costs for telcos. What follows is a brief outline of some of the key developments in 1Q21.

Telco deals with webscalers

Key deals from 1Q21 include the following.

Telefonica has engaged IBM, classified as a webscale operator in our coverage, to act as a systems integrator for an open RAN trial in Argentina. The proof of concept includes software and hardware components from Altiostar, Red Hat (an IBM subsidiary), Quanta, Gigatera, and Kontron. SDx Central notes that the trial follows on recent work between IBM and Telefonica on an overhaul of the telco’s enterprise-focused cloud platform (“Cloud Garden 2.0”)

TIM Brasil announced it would work with Oracle and Microsoft to migrate all of its on-premises workloads to the cloud. Capacity Media notes that the telco will “leverage Oracle Cloud Infrastructure (OCI) and Microsoft Azure, to move its mission-critical applications to the cloud, optimising and simplifying management of its IT infrastructure, as well as improving scalability and agility.”

SK Telecom made several announcements in 1Q21:

  • The company will connect its 5G mobile edge computing services with 34 other telcos across multiple regions via the Bridge Alliance. 
  • With Dell Technologies and its subsidiary VMWare, SK Telecom will create a technology called OneBox MEC to combine private wireless capabilities with an edge computing platform.
  • In early January, the Korean telco announced the launch of SKT 5GX Edge in collaboration with Amazon Web Services. The service allows its customers to build mobile applications that require ultra-low latency, according to Capacity Media.

South African provider Vodacom Business announced that it was certified as “the first” AWS partner in Africa to attain the AWS Outposts Ready designation. Vodacom clients can purchase datacenter managed services from both Vodacom and AWS, choosing a mix of private cloud on-premises, Vodacom data center hosting, public cloud using a local AWS availability zone, or a combination of multiple options.

Telecom Egypt has selected IBM and its Red Hat unit to develop an open hybrid cloud strategy. Per Computer Weekly, the largest telco in Egypt “has implemented IBM Cloud Pak for Automation to infuse artificial intelligence (AI) into its workflows to provide the flexibility to scale automation projects quickly, across any cloud or on-premise environment.”

Google Cloud announced a win at Canada’s Telus billed as a 10-year strategic alliance. The two will co-develop “new services and solutions that support digital transformation within key industries, including communications technology, healthcare, agriculture, security, and connected home.” The collaboration will also target network modernization within Telus’ operations. Telus will use GCP’s managed application platform, Anthos, to support 5G services and mobile edge computing.

Singtel announced it would offer 5G edge computing over the Microsoft Azure cloud platform. Trials will start later this year, and ultimately allow Singtel clients to run applications such as autonomous vehicles, drones, robots, and VR/AR with very low latency.

Australia’s Optus, a unit of Singtel, signed a 3-year partnership with Google Cloud to transform its customer support operations, using GCP’s Contact Center AI solution.

Globe Telecom in the Philippines announced it would use AWS to accelerate its own digital transformation and improve customer experience. Per the Manila Standard, Globe has “migrated carrier-grade and mission-critical applications, including contact center operations, customer analytics, network and service assurance systems and infrastructure operations, monitoring, and security, from its on-premises data centers to AWS.” That includes transitioning 3,000 customer service agents from a legacy Avaya solution to Amazon Connect.

Liberty Global’s Belgium unit, Telenet, announced vendors for its 5G rollout in March which include Ericsson, Nokia and Google Cloud. Ericsson won the radio access, and Nokia the core. Nokia will leverage Google Cloud’s Anthos for Telecom platform in Telenet data centers. Liberty says the Anthos platform will provide “the innovation infrastructure with solutions and applications for 5G users, to drive better customer experiences and service.”

Telecom-focused vendors partnering with cloud providers

Nokia was by far the most active of telco-focused vendors in 1Q21, announcing several collaborations with the webscale sector. 

In January, Nokia announced a partnership with GCP to develop cloud-native 5G core solutions. Nokia is supplying its voice core, cloud packet core, network exposure function, data management, and 5G core, while GCP’s Anthos for Telecom platform will serve as the platform for deploying applications. In March, Nokia expanded its work with GCP, announcing it would also partner to develop cloud-based 5G radio solutions. The collaboration leverages Nokia’s RAN, Open RAN, Cloud vRAN and edge cloud technologies with GCP’s edge computing platform and application ecosystem. Initial efforts center around Cloud RAN, and aim at integrating Nokia’s 5G virtualized distributed unit and virtualized centralized unit with Google’s edge computing platform running on Anthos. Nokia aims to certify its AirFrame Open Edge hardware with Anthos.

At the same time as the March GCP announcement, Nokia announced deals with Microsoft and Amazon. 

The Microsoft agreement will develop “new market-ready 4G and 5G private wireless use cases designed for enterprises”, combing Nokia’s Cloud RAN, Open RAN, radio access controller, and multi-access edge cloud technologies with the Azure Private Edge Zone.

With Amazon Web Services, Nokia and AWS will conduct joint R&D into enabling Nokia’s RAN, Open RAN, Cloud RAN, and edge solutions to operate “seamlessly” with AWS Outposts. The goal is to develop new customer-focused 5G solutions. Per Nokia, “operators will be able to simplify the network virtualization and platform layers for the Core and RAN network functions by leveraging the agility and scalability of cloud.” Ultimately Nokia will be able to leverage Amazon services like EC2, EKS, Local Zones and others to help automate network functions and deploy end customer applications.

Intel, which has attacked the telco market aggressively over the last few quarters, signed a deal with GCP in February to develop “reference architectures and integrated solutions” for telcos to enable 5G and edge network solutions. The collaboration involves three main aspects: virtualized RAN and open RAN solution development; a network functions validation lab; and, service delivery to the edge.

Israeli telco vendor Radcom announced the integration of its 5G assurance solution (ACE) with Microsoft Azure. Radcom says that the integration of ACE with Azure “enables operators to assure the quality of 5G services by leveraging AI and machine learning-driven assurance and automation” ACE runs as a cloud native function over the Azure Kubernetes Service.

Vendor collaborations with webscalers will continue throughout 2021, no doubt. Mavenir’s SVP for Business Development, John Baker, addressed this trend indirectly in a January interview with SDx Central: “I really do believe the hyperscalers are going to become the new telecom providers going forward…Apart from the physical radio that goes on a tower, everything we’re doing now follows the data center model, and these guys know how to manage data centers, software, and applications.”

For webscale operators to support all these new activities requires heavy investment in network infrastructure. The figure below shows capex by type, on an annualized basis, for the total webscale network operator market since 2016.

webscale capex trendline2

Blog Details

Big telco merger in Canada comes as industry capex poised for uptick in 2021

Telcos choose M&A to cope with weak revenues and new capex needs: surprise?

Rogers to buy Shaw, leaving Canada with 3 big telco groups

Earlier this week, Canadians woke up to a shock: Rogers Communications agreed to buy Shaw Communications, for US$21 billion (including assumed debt).

Rogers is Canada’s second largest telco, with a mix of wireless (61%), cable (28%), and media (11%) revenues. Among its media holdings is the Toronto Blue Jays, a baseball team. Shaw is Canada’s fourth largest telco, with just 22% of revenues coming from wireless (largely through the 2016 acquisition of Freedom Mobile), 68% in wireline consumer, and 10% wireline business. Shaw’s “wireline” revenues are delivered primarily over a cable TV network, complemented by satellite. 

Rogers-Shaw would be a big deal in any market, but adjusted for Canada’s relatively small market, it is immense. A deal of similar magnitude in the US market, 8.3 times the size of Canada (based on 2019 telco revenues), would be $174 billion. For context, three of the largest recent US telco mergers were far smaller: AT&T-Time Warner in 2016 ($85.4B, 2016); AT&T-DirecTV in 2014 ($67B); and, T-Mobile-Sprint in 2020 ($26.5B). 

The figure below shows 2019 revenues for Canada’s top telco groups, per MTN Consulting stats.

canada telco revenue

While many analysts are shocked at the deal, it’s almost a surprise that it took so long to happen. Many markets larger than Canada have consolidated around three large national telco groups. For countries like the US and Canada, with a viable cable TV sector, that consolidation has taken longer. But assuming that all three are national competitors across wireline and wireless, the number three doesn’t appear unreasonable on its face. That’s especially true as telcos struggle with both flat revenues and growing competition from the cloud/webscale sector.

5G isn’t cheap

What’s worth looking at it is, why is such a deal taking place now?

One obvious answer is the turmoil caused by COVID-19. Like telcos elsewhere, those in Canada saw revenue declines in 2020. Annualized telco revenues began falling for the Canadian telco market in 2Q19, however, and the declines seen in 2020 were in the same ballpark.

Margins aren’t an obvious issue, either. For Rogers, margins have held steady, with EBITDA margin improving in 2020 vs 2019 for both its wireless and cable units (media dropped slightly). Shaw’s most recent quarter, ended November 2020, saw company EBITDA margins up to 44.3% from 42.5% in the quarter ended November 2019.

The more likely answer is the need to ramp up 5G networks and roll out services. And that is exactly what Rogers’ CEO argued in the analyst conference:

“Without question, the deal will accelerate deployment of 5G around the country and will assure competition and capital continue to be prioritized and reinvested in new technologies at home here in Canada and especially in Western Canada…Today, both companies invest $3.7 billion annually in CapEx. And the underlying investment in 5G inherent in this total will only go up as 5G technologies continue to roll out across the country. This is a big task for both companies. And when combined, both companies are up for the challenge.”

This statement came along with a specific commitment to invest C$2.5B “to build 5G networks in Western Canada,” and C$1B for the creation of a “Rural and Indigenous Connectivity Fund.” 

Rogers says it expects up to C$1B in cost synergies, a mix of opex and capex, but says that most of the capex savings will be put back into the network: “more fiber, more connectivity, more rural connectivity and a few other programs related to the network,” per the CFO. The opex part is significant. New service platforms can require huge investments in expense categories like sales & marketing, among others, something which a combined Rogers-Shaw may be better able to cope with.

Beyond Canada

MTN Consulting expects global telco capex to rise slightly this year, from approximately $280 billion in 2020 to $292B in 2021. This modest growth is consistent across regions, as shown in the figure below from our latest capex forecast.

telco capex by region

In Canada, capex has been on the decline, from US$13.9B in 2018 to $13.8B in 2019 to $12.6B for the 12 months ended September 2020. Canadian telcos, however, are just beginning to deploy 5G – the bulk of the work is in the future, with many key vendor awards just concluded in mid-2020. Like the global market, Canada can expect a capex uptick in the next couple of years, albeit a modest one. Market leader BCE, for instance, has pledged to spend an extra C$1B to C$1.2B in 2021-22, with most (C$700M) in 2021; roughly 2/3 of the spending increase is for wireline, 1/3 for wireless. The second largest player, Telus, has projected 2021 capex to be flat with 2020; whether Telus is forced to increase in response to a faster rollout by others, though, is a real possibility.

What about other markets? What do 4Q20 earnings reports from key telcos suggest is on the way in 2021 and 2022 with regards to capex? Below are a few highlights:

  • America Movil: 2021 capex in line with 2020 at around US$8B
  • Charter: 2021 capex to be consistent as a percentage of revenue with 2020
  • China Telecom: 87B RMB in capex, from 85B in 2020, much lower spend on 4G, higher spend on “industrial digitization” 
  • China Unicom: 2021 capex of 70B RMB flat with 2020, 5G still roughly half of total in both years.
  • Comcast: “we are confident in our ability to increase profitability, expand margins and improve [i.e. reduce] CapEx intensity both in 2021 and thereafter”
  • DT: cash capex excluding spectrum is “expected to amount to around EUR 18.4 billion in 2021 and to remain stable in 2022. We want to continue investing heavily in building out our network infrastructure in Germany, the United States, and Europe in order to safeguard our technology leadership in the long term.”
  • Etisalat: capital intensity in 2021 of 16-18%, from 13.7% in 2020 due largely to 5G spend.
  • KPN: forecasts 1.2B Euros in capex for 2021, up from 1.1B, as it expects “another step-up in fiber CapEx to roll out or ramp up further to approximately 500,000 households.”
  • KT: 2021 capex likely flat but a much different mix, with more digital, AI and cloud focus.
  • STC: “expecting a slight decline” in capex for 2021 despite investing heavily in 5G expansion
  • Swisscom: “CapEx outlook is at around CHF 2.3 billion for the group, of which Switzerland a bit more than CHF 1.6 billion. We expect the CapEx slightly higher because of the FTTH rollout, and Fastweb steady at EUR 0.6 billion.”
  • Tele2: 2020 capex of 2.7B SEK was up from 2.4B in 2019; capex will grow to 2.8-3.3B range in 2021 due to 5G rollout. But company says “expect capex to be at low levels compared to peers even during the roll-out of 5G and Remote-PHY”
  • Telefonica: after capex declines in 2020, “CapEx to sales will trend back to normalized pre-COVID level, up to 15% of sales”
  • Turkcell: “We will continue to invest our infrastructure at around 20% of sales, driven mainly by capacity and software investment upgrades as well as expansion of fiber infrastructure.”
  • Veon: increased capex from $1.74B in 2019 to $1.9B in 2020 and expects a similar level for 2021 and 2022.
  • Verizon: capex of $17.5-18.5B in 2021, from $18.2B in 2020; focus on “further expansion of our 5G Ultra-Wideband network in new and existing markets”

As shown above, most telcos suggest capex in 2021 will be roughly flat, either on an absolute basis or capex/revenue basis. Nowadays few telcos want to boast of high spending to shareholders. However, quite a few telcos do expect capex growth over the next year or two. Not exactly a surge of spending, but on net consistent with MTN Consulting’s forecast of a slight uptick in the market.

On the supply side there will be significant change underway over the next two years, with Huawei taking more of a backseat. Some telcos worry that this may leave them paying too much for their network infrastructure, due to weaker supply side competition. Telcos will hedge their bets by ramping up collaboration with webscalers when possible, and continuing to explore open networking and network disaggregation. 

Blog Details

Webscale earnings and 2021 capex outlook

Amazon drives webscale capex jump in 4Q20, Alphabet lags; Oracle’s 63% YoY increase is sign of OCI ramp 

Webscale capex on track to close 2020 around $122 billion

Most webscale network operators (WNOs) have now reported 4Q20 earnings. For a large sample of reporting WNOs, 4Q20 capex jumped by an average of 52% YoY versus 4Q19. Amazon was by far the most significant company, spending over $14 billion on capex in 4Q20, from $5.3B the year prior. Remove Amazon, and the YoY increase was only 14%. This is a sign of both how influential Amazon has become in the cloud and how COVID-19 enticed the ecommerce side of its business to ramp up logistics and fulfillment capacity.

The figure below illustrates YoY changes in capex for key WNOs who have already reported earnings. As shown, all but Cognizant and Alphabet increased capex YoY on an absolute basis (in US$), but nobody comes close to the Amazon surge.

webscale prelim capex change 4Q20

In MTN Consulting’s recently published capex forecast, we projected that webscale capex would close out 2020 around $122 billion, up from $104 billion in 2019. Preliminary results from 4Q20 are consistent with this projection. Looking further out, we still expect webscale capex to continue solid growth, climbing to just over $200B by 2025. The network/IT/software portion of capex will come in at roughly 50% in 2020, as it did in 2019, decline to 42% by 2023 as a spate of new data centers come on line, but grow back up to 50% by 2025 as more of capex is for server/capacity expansion of existing infrastructure. Within the technology part of capex, data centers and their components (networking, compute, storage, power) will soak up the bulk of spending, but subsea cables and satellite networks will become increasingly important over the next 5 years.

Earnings calls: A rundown of webscale capex & plans for 2021

Oracle has big plans for expanding it data centers in 2021, according to its fiscal 2Q (calendar year 4Q20) earnings call on December 2020. The technology corporation, now headquartered in Houston, reported that it plans to continue adding new data centers through 2021, and expects to have 38 by YE-2021.

Oracle is a small cloud player relative to Amazon, especially considering Oracle’s heavy reliance on collocated facilities (mainly with Equinix). However, Oracle is clearly becoming more significant in the cloud, and its use of Ampere’s data center chips could also have an impact on the competitive landscape in the chip market.

Oracle’s frequent mention of its data center plans indicates a high commitment to its cloud rollout and a bullish outlook on its prospects in this business. During the first half of its earnings call, Chairman Larry Ellison noted the company’s “great quarter” would have been even better if it had not been capacity constrained in Oracle Cloud Infrastructure (OCI). He said to remedy this Oracle is adding OCI capacity and building OCI data centers as fast as it can. Ellison claimed that, as of December, Oracle had increased its footprint to 29 regional data centers worldwide, “more than AWS” (per Oracle), adding customers, and growing revenue well over 100% year-on-year.

Ellison explained that Oracle’s strategy recognizes that, because the company has a large existing business and installed base of software customers, “we just have to get into more countries than someone – than Amazon, let’s say, because we have to serve those customers where we have an installed base.”  He pointed to Indonesia and Israel as examples: Indonesia is a very big country with a lot of people where Oracle has a large installed base, “but a lot of people don’t have data centers there.” Ellison said it’s very important to get a good data center in Israel, but “some of the cloud companies have been late to get there.”

CEO and Director Safra Ada Katz noted Oracle has greatly increased its capital spending plans due to strong demand, and expected that it will increase 50% sequentially in 1Q21. Such an increase would imply around $850M of capex in 1Q21, a 144% increase relative to 1Q20. Oracle’s data center strategy has traditionally been capex-light due to the company’s partnership with Equinix, which provides many of the properties into which Oracle installs its equipment. That makes Oracle’s capex increases all the more significant.

Amazon’s earnings call revealed very little about its data center plans, in contrast to Oracle. That’s consistent with history but also may be due to management changes. Amazon promoted its AWS CEO, Andy Jassy, to replace CEO and founder Jeff Bezos just before its earnings call webcast on February 2, 2021. In response to a capex outlook question, CFO Brian Olsavsky said “We are working through our future plans.” Olsavsky did elaborate somewhat, suggesting that its 2020 capex reached $44B due to some unusual one-off investments.

Like Amazon, most other webscale providers avoided specifics on data center investment plans for 2021 on their 4Q20 earnings calls. Oracle was a standout. Clearly Oracle wants to make a splash in the market quickly, and assure its customers and prospects that its infrastructure is rapidly getting up to speed relative to the top 3 (AWS, Azure, and GCP).

Among the 17 WNO companies tracked by MTN Consulting, Alphabet had the second largest annualized capex through 3Q20, at $23B (behind Amazon). Looking forward to 2021, SVP Eric Schindler said he expected the pace of investment to return to normal levels, with spending on servers driving an increase: “Servers will continue to be the largest driver of spend on technical infrastructure.”

In addition to servers and new data centers, Alphabet continues to spend on subsea cables. For instance, Google reported on its blog on February 3, 2021 that its new Dunant subsea cable, which connects US and Europe, is now ready for service. The Dunant cable, which was made in partnership with SubCom, will have ultimate capacity of 250 Terabits per second, “enough to transmit the entire digitized Library of Congress every second.” Google notes that “Dunant is the first long-haul subsea cable to feature a 12 fiber pair space-division multiplexing (SDM) design.”

Facebook is the most bullish of the big webscale providers in terms of its 2021 investment outlook. During its 4Q20 Earnings call, Facebook CFO Dave Wehner said “We continue to expect 2021 capital expenditures to be in the range of $21 billion to $23 billion, driven by data centers, servers, network infrastructure and office facilities.” This compares to a 2020 capex total of just $15.1 billion. Wehner said several projects were delayed in 2020 due to the pandemic.

Microsoft CEO Satya Nadella noted that the company has announced 7 new data center regions recently, in Asia, Europe, and Latin America, which will contribute to capex over the next few quarters. CFO Amy Hood, speaking just after Nadella, said the company expects to see a “sequential increase on a dollar basis” in capital expenditures in 1Q21 as the company continues to meet growing global demand for its cloud services. Microsoft spending on finance leases, a.k.a. capital leases, is also significant and contributes to the company’s network infrastructure footprint.

IBM, which made no specific mention of data centers in its 4Q20 call, had much discussion of its focus on and efforts to bring AI-powered automation across its platform. IBM says it is building out its cloud integration offerings for this purpose. CEO Arvind Krishna also discussed quantum computing, and claimed that this “has the potential to unlock hundreds of billions of dollars of value” for its clients by the end of the decade. IBM says it has a roadmap to build a 1,000 qubit quantum computer by 2023.

Baidu is one of the smaller WNOs but, like Oracle, its 4Q20 capex grew significantly, up 162% from 4Q19 to reach $329M in 4Q20. Baidu did not speak specifically about data centers or capex projections in its earnings call. The company’s focus was on its self-driving and auto-driving projects, mentioning some combination of those terms 51 times. These projects require high levels of R&D spending. During its call, the CFO Cheng Chun Yu noted that it spent about 21% of its $12.1B USD core revenue in 2020 on research and development. During the call, a questioner asked how much time the company spends on different segments and what its priorities are. CEO Yanhong Ling answered that “half of our time and resources are invested in the mobile ecosystem part, and the other half in the AI cloud and intelligent driving and other growth areas…going forward, we will continue to do this”. Baidu has fallen in relative importance over the years, but it will remain an important player in the webscale market.

SAP made one minor reference to capex and data centers in its call. CFO Luka Mucic said there will be additional capex requirements this year and next for the purpose of harmonization and modernization of its cloud infrastructure. Apple and eBay made no mention of future capex or data center investments in their latest earnings calls.

Blog Details

Webscale sector’s capex push to bring many more data centers online in 2021-23

Webscale sector’s capex push to bring many more data centers online in 2021-23

Capex surge from webscale operators will continue

Technology spending by the webscale sector is on a tear. While COVID-19 depressed the telco sector in 2020, strong demand for cloud services and ecommerce drove the webscale operators providing these services to expand investments considerably. Webscale capex rose 25% YoY to hit $34.7 billion in 3Q20, or $120.9 billion on an annualized (12 month) basis. That amounts to 42% of the telco industry total for the same period. Just three years prior, in the 3Q17 annualized period, webscale capex was only 24% of the telco market.

The webscale market is dominated by a small number of big spenders. Alphabet, Amazon, Facebook and Microsoft captured 70% of sector capex in the last 4 quarters, Apple added 6%, and each of China’s two big players (Alibaba and Tencent) added another 5% each. Going forward, China will account for a bigger share of the total, possibly as much as 20% by 2025.

As a reference point, the figure below illustrates recent single quarter capex trends for the 5 biggest US-based and 3 biggest China-based webscale providers.

webscale capex top 8

Source: MTN Consulting

The growth in 3Q20 wasn’t a one-time thing. While the outlook for telco capex is modest, MTN Consulting expects webscale sector capex to end 2021 at roughly $143 billion, and grow further to reach approximately $201 billion by 2025 (figure, below). The network/IT/software portion of capex will come in at roughly 50% of total in 2020, as it did in 2019, decline to 42% by 2023 as a spate of new data centers come on line, but grow back up to 50% by 2025 as more of capex is for server/capacity expansion of existing infrastructure. Within the technology piece of capex, data centers and their components (networking, compute, storage, power) will soak up the bulk of spending, but subsea cables and satellite networks will become increasingly important over the next 5 years.

Webscale capex outlook to 2025

Source: MTN Consulting

All of the big webscale providers have major data center construction or expansion projects underway, in multiple corners of the world. Some of this activity leans on partners from the carrier-neutral sector, for instance Oracle is relying heavy on leased collocation space from Equinix for the Oracle cloud buildout. However, the bulk of webscale capex is aimed at enormous, self-owned facilities designed to spec. The choice of location is crucial, and depends on many factors, including access to major population centers, big customers, submarine cables, internet exchanges, and low-cost renewable energy; government incentives such as tax abatements; and how the location complements the operator’s overall global network strategy. Because location is so important, many webscale providers buy land in attractive markets far in advance of a decision to build a data center; this is known as “land banking.”

Below is a brief summary of some of the webscale sector’s major data center projects, either currently underway or recently completed.

Table 1: Data center projects underway – a snapshot

webscale DC summary table

Source: MTN Consulting