Global Telco Market Tracker, 2Q25: Capex pullback persists even as revenues surge 4.6%
Telco revenues surge 4.6% in 2Q25; capex restraint signals focus on profitability
By Arun Menon
By Arun Menon
This report delivers a detailed analysis of the global telecommunications network operator (telco) industry, drilling down into performance for 140 telcos from 1Q11 through 2Q25. It captures revenue, labor, capex, opex, and profitability data with a focus on the most recent quarter (2Q25).
Key findings:
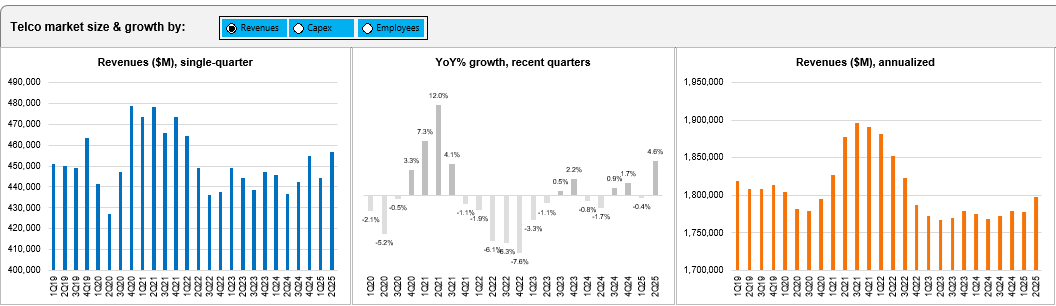
- Global telco revenues climbed 4.6% year-over-year (YoY) in 2Q25 to reach $456.8 billion (B), supported by broad-based recovery across major markets. On an annualized 2Q25 basis, revenues grew 1.7% YoY to $1.8 trillion (T). Airtel (20.0%), Etisalat (18.7%), SoftBank (7.3%), Deutsche Telekom (4.6%), and China Unicom (3.7%) led growth in the annualized 2Q25 period, while Vodafone (-11.6%) and Orange (-7.1%) declined sharply.
- Capex declined 2.1% YoY in 2Q25 to $67.5B, while the annualized total fell 2.6% to $292.9B. That’s the lowest 12-month total since 2011, and the lowest capital intensity since 2013. China Mobile remained the largest investor with $24.4B in annualized capex (+7.8% YoY) in 2Q25, while America Movil (-24.5%), China Telecom (-22.9%), and China Unicom (-17.7%) made significant cutbacks. Telco tech spending continues to shift modestly towards software and services, which may be recorded as opex rather than capex, but telcos remain vigilant cost cutters across the board.
- Labor costs fell 1.3% YoY to $258.1B in the annualized 2Q25 period, with telco headcount shrinking to 4.36 million. Labor represented 21.7% of opex (excluding D&A) for the annualized 2Q25 period, down a bit from 22.2% in 2Q24.
- Profitability margin inched higher in the latest annualized period from a year ago, with EBITDA at 33.8%, suggesting stable operational efficiency despite cost pressures. EBIT margin also edged up a bit, from 14.9% in 2Q24 to 15.5% for the 12 months ended June 2025.
- Regionally, Asia maintained its lead with 36.8% of global telco revenues in 2Q25, slightly ahead of the Americas (36.3%). On the capex spending front, the Americas outspent all other regions, boosted by network spending from AT&T and Verizon.
Description
This report delivers a detailed analysis of the global telecommunications network operator (telco) industry, drilling down into performance for 140 telcos from 1Q11 through 2Q25. It captures revenue, labor, capex, opex, and profitability data with a focus on the most recent quarter (2Q25).
Key findings:
- Global telco revenues climbed 4.6% year-over-year (YoY) in 2Q25 to reach $456.8 billion (B), supported by broad-based recovery across major markets. On an annualized 2Q25 basis, revenues grew 1.7% YoY to $1.8 trillion (T). Airtel (20.0%), Etisalat (18.7%), SoftBank (7.3%), Deutsche Telekom (4.6%), and China Unicom (3.7%) led growth in the annualized 2Q25 period, while Vodafone (-11.6%) and Orange (-7.1%) declined sharply.
- Capex declined 2.1% YoY in 2Q25 to $67.5B, while the annualized total fell 2.6% to $292.9B. That’s the lowest 12-month total since 2011, and the lowest capital intensity since 2013. China Mobile remained the largest investor with $24.4B in annualized capex (+7.8% YoY) in 2Q25, while America Movil (-24.5%), China Telecom (-22.9%), and China Unicom (-17.7%) made significant cutbacks. Telco tech spending continues to shift modestly towards software and services, which may be recorded as opex rather than capex, but telcos remain vigilant cost cutters across the board.
- Labor costs fell 1.3% YoY to $258.1B in the annualized 2Q25 period, with telco headcount shrinking to 4.36 million. Labor represented 21.7% of opex (excluding D&A) for the annualized 2Q25 period, down a bit from 22.2% in 2Q24.
- Profitability margin inched higher in the latest annualized period from a year ago, with EBITDA at 33.8%, suggesting stable operational efficiency despite cost pressures. EBIT margin also edged up a bit, from 14.9% in 2Q24 to 15.5% for the 12 months ended June 2025.
- Regionally, Asia maintained its lead with 36.8% of global telco revenues in 2Q25, slightly ahead of the Americas (36.3%). On the capex spending front, the Americas outspent all other regions, boosted by network spending from AT&T and Verizon.
Table Of Contents
- Report Highlights
- Summary
- Market snapshot
- Analysis
- Key stats through 2Q25
- Labor stats
- Operator rankings
- Company drilldown
- Company benchmarking
- Country breakouts
- Country breakouts by company
- Regional breakouts
- Raw Data
- Subs & traffic
- Exchange rates
- Methodology & Scope
- About
Figure & Charts
- TNO market size & growth by: Revenues, Capex, Employees – 1Q19-2Q25
- Regional trends by: Revenues, Capex – 1Q19-2Q25
- Opex & Cost trends
- Labor cost trends: 1Q20-2Q25
- Profitability margin trends: 1Q20-2Q25
- Spending (opex, labor costs, capex): annualized and quarterly trend
- Workforce & productivity trends: 1Q14-2Q25
- Operator rankings by revenue and capex: latest single-quarter and annualized periods
- Top 20 TNOs by capital intensity: latest single-quarter and annualized periods
- Top 20 TNOs by employee base: latest single-quarter
- Company Drilldown: YoY growth in single quarter revenues
- Company Drilldown: Revenue and revenue split, single quarter and annualized 1Q16-2Q25
- Company Drilldown: Capex and capital intensity (annualized), 1Q16-2Q25
- Company Drilldown: Revenue split by country, 2Q25
- Company Drilldown: Costs and Profitability, 1Q16-2Q25 ($ Mn)
- Company Drilldown: Labor costs, per employee and % opex trends, 1Q16-2Q25
- Company Drilldown, Cash & debt levels (2011-24)
- Company Drilldown: Software as % of total capex
- Company Drilldown: Software & spectrum spend
- Company Drilldown: Total M&A, spectrum and capex (excl. spectrum)
- Country Breakouts: Revenue and Capex, Market Share, and Capital Intensity
Coverage
Operator coverage:
| A1 Telekom Austria | Advanced Info Service (AIS) | Airtel | Altice Europe | Altice USA | America Movil | AT&T | Axiata | Axtel | Batelco |
| BCE | Bezeq Israel | Bouygues Telecom | BSNL | BT | Cable ONE, Inc. | Cablevision | Cell C | Cellcom Israel | CenturyLink |
| Cequel Communications | Charter Communications | China Broadcasting Network | China Mobile | China Telecom | China Unicom | Chunghwa Telecom | Cincinatti Bell | CK Hutchison | Clearwire |
| Cogeco | Com Hem Holding AB | Comcast | Consolidated Communications | Cyfrowy Polsat | DEN Networks Limited | Deutsche Telekom | Digi Communications | DirecTV | Dish Network |
| Dish TV India Limited | DNA Ltd. | Du | EE | Elisa | Entel | Etisalat | Fairpoint Communications | Far EasTone Telecommunications Co., Ltd. | Frontier Communications |
| Globe Telecom | Grupo Clarin | Grupo Televisa | Hathway Cable & Datacom Limited | Idea Cellular Limited | Iliad SA | KDDI | KPN | KT | Leap Wireless |
| LG Uplus | Liberty Global | M1 | Manitoba Telecom Services | Maroc Telecom | Maxis Berhad | Megafon | MetroPCS Communications | Millicom | Mobile Telesystems |
| MTN Group | MTNL | NTT | Oi | Omantel | Ono | Ooredoo | Orange | PCCW | PLDT |
| Proximus | Quebecor Telecommunications | Rakuten | Reliance Communications Limited | Reliance Jio | Rogers | Rostelecom | Safaricom Limited | Sasktel | Shaw |
| Singtel | SITI Networks Limited | SK Telecom | Sky plc | SmarTone | SoftBank | Spark New Zealand Limited | Sprint | StarHub | STC (Saudi Telecom) |
| SureWest Communications | Swisscom | Taiwan Mobile | Tata Communications | Tata Teleservices | TDC | TDS | Tele2 AB | Telecom Argentina | Telecom Egypt |
| Telecom Italia | Telefonica | Telekom Malaysia Berhad | Telenor | Telia | Telkom Indonesia | Telkom SA | Telstra | Telus | Thaicom |
| Time Warner | Time Warner Cable | TPG Telecom Limited | True Corp | Turk Telekom | Turkcell | Veon | Verizon | Virgin Media | Vivendi |
| Vodafone | Vodafone Idea Limited | VodafoneZiggo | Wind Tre | Windstream | Zain | Zain KSA | Ziggo | ||
| Masmovil Masorange |
Regional coverage:
| Asia | Americas | Europe | MEA |
Visuals